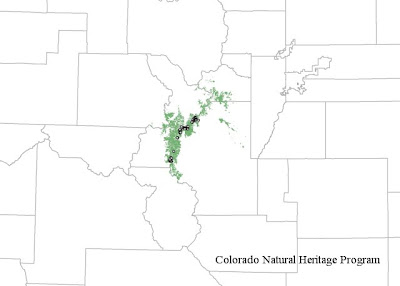
This year’s NatureServe Biodiversity without Boundaries (BWB) conference took place in Portland, OR and we lucked out with a week of unusually sunny weather. The conference was a great opportunity to meet staff from other Natural Heritage programs and learn about their work. I attended sessions focused on mapping and modeling and learned a great deal. One of the early talks was on the subject of increasing modeling capacity at the various programs, and on that note, I went out to receive some training.
The highlight of the trip for me was an R training workshop held at the Oregon Biodiversity Information Center on the Portland State University Campus. The training was led by Emile Henderson of the Oregon Biodiversity Information Center and Tim Howard from the New York Natural Heritage Program. The workshop was focused on building species distribution models using the RandomForest ensemble classifier object in the statistical software package R.
| The R Project - Not just a letter of the alphabet anymore. |
The basic concept of species distribution modeling is that you know locations where a species has been observed and you also know things about the environment at the locations where the species have been observed. If you have many species observations, and many range-wide GIS data layers that represent variables such as elevation, aspect, annual precipitation, soils, geology and many other variables, you can combine these pieces of information to create a profile of environmental variables that supports the species. Then you can look at other places, places the species has not been observed and say “do the environmental variables at this location match up to what I know about where this species likes to live?”
The output of the modeling process is a raster (cell-based) dataset that for each cell includes a probability of the species occurring in that cell location. The modeler can set a probability threshold so they can effectively say “show me every raster cell that has a 75% or greater chance of my species of interest occurring in that cell.” The resulting species distribution model can guide future field surveys of the species of interest or guide conservation planning action. Models are no substitute for on-the-ground field work and observations, but they can be a useful tool to guide fieldwork and discover the qualities that make habitat suitable for a species.
A long term goal of modeling all tracked species by all member programs emerged from this year’s BWB conference. A challenging goal to be sure, but one that I hope to help CNHP achieve!


No comments:
Post a Comment
Thanks for your comment!
Please note that all comments are moderated, so there may be a delay of some hours (especially over the weekend or at night Colorado time) before your comment shows up.