In the 1970’s the US Fish and Wildlife Service started a wetland mapping program called the National Wetlands Inventory (NWI) , with the goal of mapping the entire country’s wetland resource. Using the Cowardin system of classification, most of the country was mapped from approximately 1975 to 1985 by people looking at aerial photos through stereoscopes and drawing the wetland outlines with markers on sheets of transparent plastic. This original mapping was at resolutions ranging from 1:24,000 to 1:50,000. Over the course of the following decades, individual states have scanned these data into image files that can be viewed on a computer screen, and many have produced updated data building upon the same basic methodology. However, only recently has true digital wetland mapping really taken off.
CNHP first began working on statewide wetland data in 2008, in partnership with Colorado Parks and Wildlife (CPW). At that time, there was very little digital mapping available:

All of the data represented by blue in the above map were scanned images – useful for site-specific exploration, but not usable for analysis. CNHP and CPW have worked with a variety of partners (U.S. Environmental Protection Agency, U.S. Forest Service, Bureau of Land Management, local governments, and others) to digitize and update the 1970’s era scans and increase Colorado’s capacity to make informed decisions regarding wetlands. Now, due largely to CNHP and CPW's efforts, the statewide wetland mapping status map for 2012 looks like this:

Making informed decisions about Colorado’s wetlands has critical implications for Colorado’s biodiversity: while it is estimated that only about 2% of the land area of Colorado is wetland, that 2% of the state supports over 40 vertebrate species of concern:

Species of concern in relation to habitat prevalence.
Modern Geographic Information Systems (GIS) allow wetland mappers to improve upon the original NWI data. By using a variety of data sources and improved resolution National Agriculture Imagery Program (NAIP) true color and infrared aerial photos, wetland mappers can delineate wetlands at much finer resolutions and higher ground-verifiable accuracy. Wetlands mapped to the 2009 time period are typically mapped at 1:3,000 to 1:10,000 resolutions.
The following images show infrared / true color examples of some Colorado wetlands in Park County.

Beaver Pond Complex at high altitudes, with ponds surrounded by saturated shrubs.
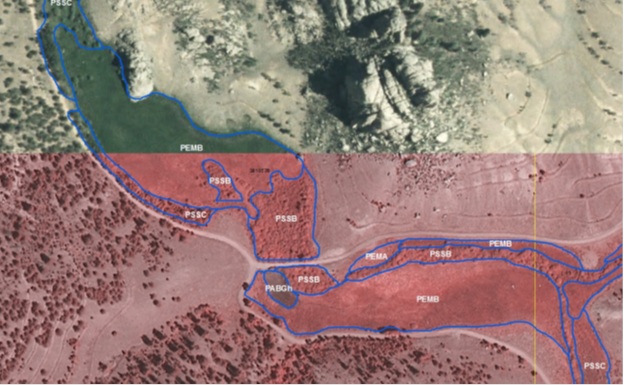
Two fens: PEMB stands for Palustrine Emergent Saturated wetland.

Alkaline playas: these wetlands are ephemeral and may go several years without a flood event. PUSCh stands for Palustrine Unconsolidated Shore Seasonally Flooded Impounded.

No comments:
Post a Comment
Thanks for your comment!
Please note that all comments are moderated, so there may be a delay of some hours (especially over the weekend or at night Colorado time) before your comment shows up.